How does the bitcoin source code define its 21 million cap?
Many of bitcoin’s staunchest critics have expressed doubt about its 21 million cap, but perhaps the most mindless criticism relates…
,
First published: 01/07/2021
| Last
updated: 01/17/2023
| -- min read
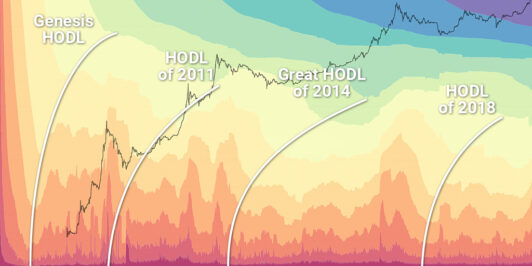
The HODL Waves is a data visualization that displays colored bands representing the percentage of total bitcoin and the length of time that bitcoin has been sitting in a given address. This visualization is made possible because the bitcoin blockchain is completely public. You can read the original article that describes them here. By comparing the age of bitcoin sitting in addresses to the current US dollar prices, we can make some interesting conjectures about the bitcoin economy and the sentiment of HODLers (what does HODL mean?).
2020 is over and etched into the bitcoin blockchain forever. While it was a wild year for those who lived it: the COVID-19 virus, protests and riots in the streets of many global cities, lockdowns and quarantines, Central Banks turning the money printers up to 11, and a contested US election, taking a step back from the noise of it all and looking at the sentiment of bitcoiners over the year makes it look… pretty standard.
Let’s take a look at some of the major events of 2020. Outside of a savage 60% price crash and speedy recovery in March 2020, the HODL waves for the year looks like what you would expect from a fledgling global currency and has tracked pretty closely to both the 2011-2013 wave and the 2014-2017 wave. While the price crash in March was sharp, we can see that the coins shifting hands during that time were coins that had previously moved within the last 6 months, indicating that the crash may have been caused by leveraged traders getting liquidated. Long-term holders were unaffected by the movement, meaning that coins that had been sitting in addresses for longer than 6 months became a higher percentage of the total bitcoin sitting in addresses. This helps explain the rapid 2 month recovery back to the previous prices.
The depths of this cycle’s long-term hodl was on September 27, 2020, when 63.35% of total bitcoin (~11.74 million BTC) hadn’t moved in longer than a year at a price of $8,251. The price finished the year at $29,000, while the tides began to shift and the long-term held bitcoin dropped down to 59.03% by December 31st.
59.03% of bitcoin held for longer than 1 year is still a long ways away from the bottom of the last cycle, which was April 10, 2018 at a price of $6,839 (after running up from $172 in January 2015), when only 41.1% of available bitcoin was held for 1 year or longer. If the 2018-2020 HODL wave looks anything like the last one, we can expect some extreme price movements as new entrants try to recapture that ~18% difference between 59.03% and 41.1% of long-term held bitcoin.
By zooming out a bit to review the entire 2018-2020 HODL Wave, we can see that the November 2018 capitulation, where bitcoin’s price crashed from around $6,000 to the cycle’s bottom of around $3,200, came from a significant percentage of the 3-5 year band. 2.43% of all bitcoin, or roughly 423,000 bitcoin were moved after sitting for 3-5 years, and more short-term bitcoin was moved during the price crash.
A vast majority of the bitcoin liquidated in November 2018 was purchased and held by long-term hodlers, which we can see appearing at the end of 2020, when the 2-3 year band expanded by 3.4% or roughly 630,000 bitcoin. The November 2018 sell-off was the final capitulation of the 2017 bull market to ~$20,000.
January 2021 is already off to a wild start, with the price cresting $40,000 per bitcoin as I write this, which is consistent with the historical price moves in bitcoin compared to HODLer sentiment at the time. As each block is discovered every 10 minutes, time marches on and bitcoin keeps working as designed, but people’s understanding and demand for bitcoin constantly fluctuates.
I’ll keep posting periodic updates to the HODL waves as bitcoin continues to make history during its monetization.
Thanks to our friends at Glassnode Studio for maintaining the HODL Waves visualization and thank you for Surfing the HODL Waves with us in 2020. We look forward to a bright 2021 and beyond for bitcoin.
Many of bitcoin’s staunchest critics have expressed doubt about its 21 million cap, but perhaps the most mindless criticism relates…
,When Satoshi Nakamoto created bitcoin, he established in its code a fixed number of bitcoin that will ever exist. Since…
Originally published in Parker’s dedicated Gradually, Then Suddenly publication. Bitcoin is often described as a hedge, or more specifically, a…